So two things worth reading for not obvious reasons.
First go read Robert Green's take on the impact of Financial Reform (HA!) on hedge funds.
Bottom line, could mean less volume moving forward as Hedgies now have to report shorts...
Also, yield chasing has to start soon sez Patrick O'Hare.
Monday, August 30, 2010
Friday, August 27, 2010
Are we Turning Japanese?
So I had a thought yesterday about yields on the 10 year dipping to under 2.5% and all this talk about Japan. So I thought...why not try to figure out if bonds are really in a bubble or if we are turning Japanese...
My buddy GX has access to a bloomberg so I asked him to send me a chart of Japanese 10 year yield during the lost decade and I asked him to overlay Japan's GDP:
 Yields are in Orange, GDP in White...the little spikes at the top of the GDP curve are at around the 2.5% area.
So then I was like...well where the hell are we on this chart? If we are turning Japanese we need to figure out where we are on this chart to really decide if Bonds are in a bubble of if we will go below 2% and reside there for a decade or so...
The instructive part of this exercise is to look at the ranges..Japan's deflationary spiral started in the early 90's then really took flight after a little double dip followed by a bigger double dip...but they never got over 3%ish on GDP growth during much of the 90's....that's when yields really took off to the downside and stayed well below 2% for the decade to come.
As the old addage goes..."OK the world is going to end...so what's the trade"...well that's of course why I go forth on these stupid academic exercises...and bug my friend's with bloombergs to make stupid charts for me...
GX...overlay the Nikkei:
 Green is the Nikkei.
Given our GDP growth rate (sub 2%) and the current yield on our 10 year Treasuries (2.5%) I would say we are either in 1994 or 1997 in Japanese years. Which definitely means we are looking at a deflationary spiral and our rates are going lower and they probably will stay there for a long long time.
All of this being said...Bonds have more room to run if we are indeed turning Japanese, also, Stocks will be fairly choppy for the next few years trading in a range that continues to decline overall...however at the bottoms and tops of these ranges vast quantities of money can be made...you just gotta go long and short.
For now...I guess you can still chase treasuries...
My buddy GX has access to a bloomberg so I asked him to send me a chart of Japanese 10 year yield during the lost decade and I asked him to overlay Japan's GDP:

So then I was like...well where the hell are we on this chart? If we are turning Japanese we need to figure out where we are on this chart to really decide if Bonds are in a bubble of if we will go below 2% and reside there for a decade or so...
The instructive part of this exercise is to look at the ranges..Japan's deflationary spiral started in the early 90's then really took flight after a little double dip followed by a bigger double dip...but they never got over 3%ish on GDP growth during much of the 90's....that's when yields really took off to the downside and stayed well below 2% for the decade to come.
As the old addage goes..."OK the world is going to end...so what's the trade"...well that's of course why I go forth on these stupid academic exercises...and bug my friend's with bloombergs to make stupid charts for me...
GX...overlay the Nikkei:

Given our GDP growth rate (sub 2%) and the current yield on our 10 year Treasuries (2.5%) I would say we are either in 1994 or 1997 in Japanese years. Which definitely means we are looking at a deflationary spiral and our rates are going lower and they probably will stay there for a long long time.
All of this being said...Bonds have more room to run if we are indeed turning Japanese, also, Stocks will be fairly choppy for the next few years trading in a range that continues to decline overall...however at the bottoms and tops of these ranges vast quantities of money can be made...you just gotta go long and short.
For now...I guess you can still chase treasuries...
Thursday, August 26, 2010
UPDATE Trade: BAC short...Winner
26-AUG-10: Exited the rest of the position at $1.43...total profit on 10 contracts $435...not too shabby.
25-AUG-10:
They said to take half off at $1.50...Order triggered. So new Cost Basis is 0.56 on the remaining position.
23-AUG-10:
Got another alert today from Extreme regarding BAC.
So I am short BAC via the Aug (weeklys) $14 puts.
Entered 10 Contracts for $1.03 each.
This was entered based on the hourly chart showing a retest.
Chart:

Wednesday, August 25, 2010
Sniper trades
Potential longs using the skills acquired from Options Sniper:
PAY, COST, BKC, PCG, SLV, LO...and a few others
Potential shorts:
STI, ACI, DVN, MEE
there are others but the market is at major support and the bottom of the range...so I dont really like shorts here.
PAY, COST, BKC, PCG, SLV, LO...and a few others
Potential shorts:
STI, ACI, DVN, MEE
there are others but the market is at major support and the bottom of the range...so I dont really like shorts here.
Tuesday, August 24, 2010
Trade: NFLX Long Calls...Loser
24-AUG-10:
Update Looser trade and it was a big one sold for $8 for a loss of $1040. I didn't follow the signal that was saying to exit yesterday and this cost me about $600.
Stupid stupid. Bad Bad. In any case, while I almost made up for it with GOOG, this is unacceptable and I simply should not have traded this given the system was giving only daily signal and the hourly was very range bound.
Lesson learned and this is the first time in a long time that I didn't have the discipline to cut a loss properly.
21-AUG-10:
I was looking at NFLX on Thursday as it had retested on Wednesday and rebounded nicely on Thursday.
Then Friday Headley came across with an alert not to trade but some picks for the coming week (they included long BIDU and Short RIMM). Anyway that gave me the confidence to pull the trigger (silly as that sounds).
Picked up a couple of Sep $120 Calls for $13.20 each (2 contracts). Only in the taxable account. I had chased this a little bit but that's OK. Price's target is $140 on NFLX.
I am thinking that I should have picked these up across all the accounts but I didn't...oh well.
Anyway let's hope for the best here.
Charts:
Daily:

4hr:

Trade: Short GOOG...Winner!
24-AUG-10:
Update...Sold for a cool $1,000 at $24.50...my target for this option was the lower bollinger on the daily chart (I figure this was a decent level of resistance). This level resided at around $255 level in GOOG.
The hourly chart however, says to hold on...but I hit my target and am happy with the results.
23-AUG-10:
I noticed that one thing that Headley and company focus on is liquid stocks with liquid options. They are now moving on the weekly options. This drastically reduces their universe of stocks and, I think it also increases their odds of success with every trade. Its easier to get out at the price you want if price discovery isn't a problem for the instrument...this has been a problem for me...but looking at shorter time frames you get many more opportunities....so its OK to have a limited universe because there are more bars showing opportunities.
Over the weekend, I viewed two videos that came with my options sniper subscription, which are basically coaching videos (without the sales pitch). In the videos Headley discusses the use of CCI as a primary indicator in these volatile markets, particularly its use when it comes to the hourly chart aggregation period.
Anyway the process is the same as with %R, you get a retest and that bar's high is a stop...etc you know the drill.
Looking through the small universe of stocks that have weekly options, I noticed GOOG had set up nicely last week for a fast move down, and today (right now at the 2PM hour)...we have a retest forming on CCI (and a few other indicators) ADX is still green and strong and %R is also retesting.
Anyway its a pretty good actionable trade if you ask me. Now Headley doesn't like these higher priced stocks because it reduces the # of options you have and also the bid/ask spreads are wider...so he probably wont send an alert about this one...but I am putting what I have learned to practice here.
I pulled the trigger on one GOOG Aug 27 $480 put for $14.50 taxable account only.
Chart:

Monday, August 23, 2010
Duh...
So TOS only allows scans based on End of Day data or current day's data.
So I think one way to circumvent this if you need to follow hourly signals is to break things down by how many days your signal is.
For example, a 30 bar %R period on an hourly chart is basically 30/7(bars per day)...or 4 days...
For CCI...60 bar setting...8 days
80 bar setting (bollingers)..11 days...this is rounded down (to compensate)
This could be a crude way of dealing with TOS's shortcomings with respect to scanning for hourly signals.
UPDATE Trade: BVF long calls... Winner!
23-AUG-10:
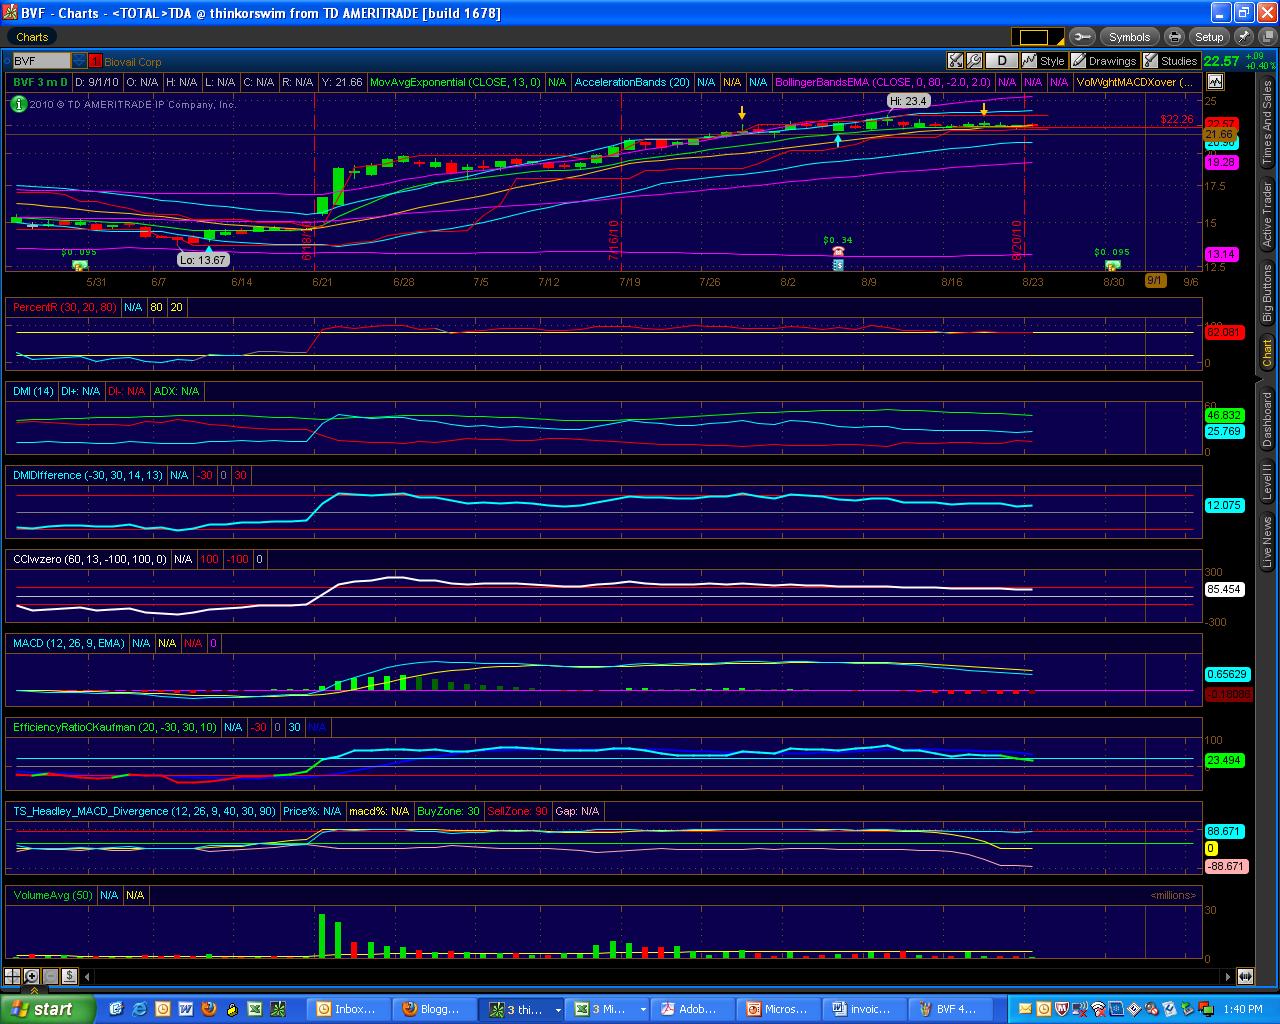
BVF has been good to me, but the profit/loss on this thing hasn't done anything since earnings...the stock has flat lined, and I have held this puppy for over 1 month and a half. I realize that this will move on the imminent FDA approval of VRX, however, I want to free up capital for the rapid moves in the Headley Sniper and Grand Slam services that I have signed up for for the next few months.
BVF has not flashed a true sell on the Daily chart, though it has done so arguably on the 4hr chart. Regardless, I want to take profits on this properly and move on...it has stalled up here and it is at dangerous heights, volume has dried up at these levels...so it can go crashing down just as well...
Cost basis was now $5.95 per contract (thanks to some profit taking previously)...I sold for $10... anyway total profit was in the neighborhood of $1,200...this was a really great trade...and all the option-able accounts benefited.
Charts:
Daily:
4HR:

6-JUL-10:
Short:
Bought 3 CRI Aug 21 2010 35.0 Put @ 8.4
This is one that popped on the scan a few days ago and due to the 4hr chart I thought I was getting in at a good price. Then I checked the market for these puts and there was no open interest. This scared me and I proceeded to try and cancel the orders I had put in...Lucky for me TOS was in a special mood today and it wasn't taking cancellation orders (this type of shenanigans also were present during the May 6th crash by the way)...SO...the orders stayed on and got filled in all but my taxable account...GOOD THING TOO...This is one of those trades where it was almost instantly profitable. The 4 hr chart doesn't really do it justice, but in the beginning of the day this was above my 13 period EMA...this was also scaring me...the volume was light though so I though it was a good short....the liquidity is a concern, but I still think I can turn a profit on these.
Nonetheless. The psychological factor here really upsets me because my taxable account isn't having any fun with this trade. I should not chicken out of trades like this anymore. When I decide to take action I should be satisfied. If anything I should have checked the liquidity previous to entering the orders, but still I would have missed this trade based on that.
One factor is that I had read 2 market forecasts (Big Trends and Noshee?) saying that the bottom may have been put in last week. This skewed my thinking for sure.
Stop is 27.17.


Short:
Bought 5 HS Aug 21 2010 20.0 Put @ 4.7
I picked this up in my taxable account today. This was something that popped on my scan on Friday. A short retest outside the bands. This is my favorite setup. I did this only in the taxable account because in this account I had missed the CRI trade in this account due to my phsycological crapping out...so I went for the next best thing which is shorting HS. I noticed Friday that this was not the only health care insurer that had this retest phenomenon, AET, UNH, also exhibited this behavior. So the sector is in trouble. However, my psychological issues right now are that we are long in the tooth with the downtrend and I fear these moves are nearer to their end than to the beginning. No matter, I am trading based on the setups.
Stop is 15.55.


Long:
Bought 4 BVF Oct 16 2010 12.5 Call @ 6.8
This was done accross accounts as a hedge against the net Shorts I am in now (besides the above I am short DCTH and CSTR (taxable account only) I have taken big profits on both positions already...so I am holding those for a while longer).
Back to the BVF trade. This thing popped big time and again showed up as a retest outside the bands on the daily chart. The 4hr chart is a bit weaker, however, still strong. If the market has found a bottom, then this is a decent hedge it is a strong stock in a weak market bucking the trend and has successfully retested and is outside the bands...The 4hr has broken the 13 EMA but regained it. This was a tough trade today and I took it because it was near enough to the retest low in price. I didn't get the best price but not too shabby either.
Stop is 18.47


UPDATE Trade: ETP Short via Puts...Winner!
23-AUG-10:
I decided to take my ETP short position off today based on the fact that after 2 days of trading since the gap down...no follow through had occurred (of course as soon as I was out of my position...down it went). On the gap down the other day it also failed to make a new low...which doesn't inspire confidence. I have also seen lots of gap downs based on new offerings turn rapidly higher.
Also, I had seen good profits go bad twice with this position...Besides that I was looking at the hourly chart and it had violated on CCI (this is a new indicator I am looking at based on Headley's Options Sniper program).
In any case, ETP has been good to me and I exited at $3.10 per contract..60 cents...and I generally had 6 contracts accross the accounts...$360 profit...not earth shattering...but good none the less.
Headley also presses the idea of time based stops...so that you can rotate your capital to the next trade that is in the early stages of rallying. So I am starting to exercise this a little more with things that are getting stale. Also left BVF today because of that.
I will say one thing. ETP has NOT flashed an exit based on the 4hr or Daily chart...so arguably this is a premature exit.
Charts:
Daily:

4HR:

10-AUG-10:
I desperately needed short exposure because I was net long and all the retirement accounts can't actually short stocks...problem is, because of liquidity, there are few options out there to suit the needs of these accounts.
Yesterday I was running my scans to see what had retested the day before or what was breaking out. In this case ETP was breaking out but not quite on the daily chart...so I checked the 4 hr chart...breakout had been confirmed...and towards the end of the day it looked like it was retesting...It reached like 19 and change on %R...I figured this was good enough for me as these options are very liquid and had decent bid-ask spreads.
Picked up the September $50 Puts for $2.50 per contract...stop is $2.00. The ask was $2.85 when my order got filled, so I figure to set the trigger at a bid of $1.80...I should get filled at $2.00
Charts:
Daily:

4hr:

Friday, August 20, 2010
Outside the Bands
Retests outside the bands today:
Longs: None
Inside the bands:
LSTZA, FBT
Shorts:
LANC
Longs: None
Inside the bands:
LSTZA, FBT
Shorts:
LANC
Thursday, August 19, 2010
The System...
Update on the ECP trading system. Paper trading of the 2nd exit strategy based on an actual entry trigger in the opposite direction has yielded interesting results.
First the results and then I will get into the interesting part:
So...unfortunately this exit strategy doesn't minimize the number of loosing trades....this is the same as the previous exit strategy.
But the winners still out pace loosers by enough to get you a profitable system over the long run...in this case 6 months worth of data.
Now for the interesting part...lucky for me, the months of January through June offer a period of low and high volatility, this is what gives me confidence in the system itself as well as the paper trading results it has provided. Plus with a total of 600 plus round trip trades, you have some pretty good statistics to back your ideas up.
So now I will post the results of the first exit strategy vs. the second exit strategy:
Ironically, Exit Strategy 1 outperformed Exit Strategy 2 during the low volatility days of January through March, then from April through June Exit Strategy 2 outperformed Exit Strategy 1.
I haven't gone back to do the academic exercise as to why this is, in a way i would think that exit 2 would do worse in higher volatility given that it keeps you in longer...but in higher volatility environments you get stronger moves so the profitable trades get more profitable.
In fact, the average profit was 0.28 for exit 1, vs 0.34 for exit 2 (21% delta) , whereas the avg loser was 0.13 for exit 1 vs. 0.15 for exit 2 (15% delta). So volatility benefits the exit 2 to the extent in that it keeps you in profitable trades longer than in loser trades...
Anyway when you combine the two you did better than using either one on its own. You would be up $8350 and not have had a loosing month, this is a 51% improvement over exit 1, and a 46% improvement over exit 2.
Now all I need is something to tell me when to switch exit strategies. Perhaps use some indicator with the VIX?
First the results and then I will get into the interesting part:
| Based on IWM | 1000 shares | Trade costs | |||
| Monthly total | Weekly avg | Net with IB | Net with TD | Total trades | |
| Jan | $40.00 | $10.00 | $705.00 | $1,938.10 | 190 |
| Feb | $490.00 | $122.50 | $210.00 | $1,508.00 | 200 |
| Mar | $1,280.00 | $320.00 | $440.00 | $1,117.60 | 240 |
| Apr | $810.00 | $122.50 | $26.00 | $1,427.76 | 224 |
| May | $2,450.00 | $612.50 | $1,715.00 | $352.10 | 210 |
| Jun | $720.00 | $144.00 | $162.00 | $1,797.48 | 252 |
| Totals | $5,710.00 | $218.58 | $1,104.00 | $7,436.84 | 1316 |
| Max Profit | $1,970.00 | Best Day | $2,220.00 | Average Profit | $0.34 |
| Max Loss | $1,080.00 | Worse Day | $2,010.00 | Average Loss | $0.15 |
| Ratio | 182% | Ratio | 110% | Ratio | 227% |
| % Winners | 33% | Best Week | $2,090.00 | Total Wins | 217 |
| % Losers | 66% | Worse Week | $1,300.00 | Total Losers | 436 |
| Ratio | 50% | Ratio | 161% | ||
So...unfortunately this exit strategy doesn't minimize the number of loosing trades....this is the same as the previous exit strategy.
But the winners still out pace loosers by enough to get you a profitable system over the long run...in this case 6 months worth of data.
Now for the interesting part...lucky for me, the months of January through June offer a period of low and high volatility, this is what gives me confidence in the system itself as well as the paper trading results it has provided. Plus with a total of 600 plus round trip trades, you have some pretty good statistics to back your ideas up.
So now I will post the results of the first exit strategy vs. the second exit strategy:
| First Exit | ||
| Monthly total | Weekly avg | |
| Jan | $1,350.00 | $337.50 |
| Feb | $760.00 | $190.00 |
| Mar | $2,260.00 | $647.50 |
| Apr | $380.00 | $142.00 |
| May | $1,460.00 | $365.00 |
| Jun | $70.00 | $47.50 |
| Totals | $5,520.00 | $240.92 |
| Second Exit | ||
| Monthly total | Weekly avg | |
| Jan | $40.00 | $10.00 |
| Feb | $490.00 | $122.50 |
| Mar | $1,280.00 | $320.00 |
| Apr | $810.00 | $122.50 |
| May | $2,450.00 | $612.50 |
| Jun | $720.00 | $144.00 |
| Totals | $5,710.00 | $218.58 |
Ironically, Exit Strategy 1 outperformed Exit Strategy 2 during the low volatility days of January through March, then from April through June Exit Strategy 2 outperformed Exit Strategy 1.
I haven't gone back to do the academic exercise as to why this is, in a way i would think that exit 2 would do worse in higher volatility given that it keeps you in longer...but in higher volatility environments you get stronger moves so the profitable trades get more profitable.
In fact, the average profit was 0.28 for exit 1, vs 0.34 for exit 2 (21% delta) , whereas the avg loser was 0.13 for exit 1 vs. 0.15 for exit 2 (15% delta). So volatility benefits the exit 2 to the extent in that it keeps you in profitable trades longer than in loser trades...
Anyway when you combine the two you did better than using either one on its own. You would be up $8350 and not have had a loosing month, this is a 51% improvement over exit 1, and a 46% improvement over exit 2.
Now all I need is something to tell me when to switch exit strategies. Perhaps use some indicator with the VIX?
Wednesday, August 18, 2010
Outside the Bands
Retests outside the bands today:
Longs:
LFL
Shorts:
CPLA, LOPE, MDAS
Breakouts:
Longs:
SYT, PKI, MOO, PTY
Shorts:
WFC
Longs:
LFL
Shorts:
CPLA, LOPE, MDAS
Breakouts:
Longs:
SYT, PKI, MOO, PTY
Shorts:
WFC
Trade: EBAY and CFL Long...Winners!
UPDATE:
18-AUG-10
Got the following exit orders today:
And so I did...this time...I got worse fills than suggested (though I tried for their recommendations...the market was working against me a bit).
CLF...filled at $8.90 per contract...this was a total of $680 profit
EBAY...filled at $2.79 per contract...total profit $235
I wont post charts because these options are expiring Friday...so it makes sense to take the money off the table now.
So far I paid $14 to make $915...this is probably the best "trade" I have made all my life. I may have to subscribe to this service.
Here's looking forward to the next trades!
17-AUG-10
I learned that the CLF trade was based on the 15 minute chart and that the signal was triggerd on CCI, %R and "the bands".
The chart follows...I don't see the band signal...but the others are all flashing...also it is important to note that the daily chart had demonstrated a %R retest on CLF...so that was also working for it.
The Option chosen also had a great chart.
CLF 15 min Chart:

CLF $55 Aug Call chart:

16-AUG-10:
Signed up for a 2 week special of Bob Lang's Extreme Options last week when they offered the service for $14 for the next 2 weeks.
Today's trades came in at 11 AM as follows:
And so I did.
I got filled at better prices.
The EBAY calls I got filled at $2.32 each (5 contracts total), the CLF calls I got filled at for $5.10 each (2 contracts total).
My small understanding of the trades are that these are based on hourly chart signals...my hourly chart settings must be different because I remember seeing the CLF trade as simply not there...ironically this is what did best today.
Anyway I will investigate the settings they use to see if I can make heads of this.
But I will attach their charts that they send in the nightly (or seminightly) update:


Now my charts:
EBAY

CLF

18-AUG-10
Got the following exit orders today:
Lock Down These Profits Today...
Place a Day Limit order To Sell (To Close)
all of existing position in eBay Inc. (EBAY)
August 20 Call (EBAY 100821C20) at 2.80 or better.
Place a Day Limit order To Sell (To Close)
all of existing position in Cliffs Natural Resources (CLF)
August 55 Call (CLF 100821C55) at 9.00 or better.
And so I did...this time...I got worse fills than suggested (though I tried for their recommendations...the market was working against me a bit).
CLF...filled at $8.90 per contract...this was a total of $680 profit
EBAY...filled at $2.79 per contract...total profit $235
I wont post charts because these options are expiring Friday...so it makes sense to take the money off the table now.
So far I paid $14 to make $915...this is probably the best "trade" I have made all my life. I may have to subscribe to this service.
Here's looking forward to the next trades!
17-AUG-10
I learned that the CLF trade was based on the 15 minute chart and that the signal was triggerd on CCI, %R and "the bands".
The chart follows...I don't see the band signal...but the others are all flashing...also it is important to note that the daily chart had demonstrated a %R retest on CLF...so that was also working for it.
The Option chosen also had a great chart.
CLF 15 min Chart:

CLF $55 Aug Call chart:

16-AUG-10:
Signed up for a 2 week special of Bob Lang's Extreme Options last week when they offered the service for $14 for the next 2 weeks.
Today's trades came in at 11 AM as follows:
Place a Day Limit order To Buy (To Open)
a HALF position in eBay Inc. (EBAY)
August 20 Call (EBAY 100821C20) at 2.37 or better.
Place a Day Limit order To Buy (To Open)
a HALF position in Cliffs Natural Resources (CLF)
August 55 Call (CLF 100821C55) at 5.50 or better.
And so I did.
I got filled at better prices.
The EBAY calls I got filled at $2.32 each (5 contracts total), the CLF calls I got filled at for $5.10 each (2 contracts total).
My small understanding of the trades are that these are based on hourly chart signals...my hourly chart settings must be different because I remember seeing the CLF trade as simply not there...ironically this is what did best today.
Anyway I will investigate the settings they use to see if I can make heads of this.
But I will attach their charts that they send in the nightly (or seminightly) update:


Now my charts:
EBAY

CLF

UPDATE: Trade: Short FIS Sep $28 Puts - Loser
18-AUG-10:
Got filled on the others at $1.50...of course it is going down now.
17-AUG-10:
Another loser here. Unfortunately, my stop got taken out on the 4hr chart and I had to exit this trade. The problem was that I was unable to get my $1.50 offer and wasn't able to exit entirely from the trade in all the accounts. Currently, the taxable and my sister's IRA are still holding this issue, the other accounts I unloaded for $1.42 or $1.43.
I had purchased some of these in these accounts yesterday using a retest as an opportunity...So the Cost Basis was $1.78 on these still, not a good loss to take 36 cents per contract and I was holding quite a few.
Trade triggers were fired as the Bid hit 1.45...my offer was $1.50 and it didn't even come close to getting filled at that price...I was battling for bids at the $1.42...got a partial fill on my sister's account at $1.43....good for TD...bad for me...gotta get the rest filled tomorrow...probably into a shitty tape.
In fairness, this did violate %R on the 4hr chart by a penny but this violation occured outside the bands...and most other indicators were still in sell terroir...So I held thinking this wasn't a good enough reason to sell and my risk hadn't been even close to being reached.
Anyway...charts:
Daily:

4hr:

12-AUG-10:
Despite being at some level of support, I feel that somethings have technical damage sufficient enough to trade to the downside. This is true in all markets...there are stocks that are rallying today (e.g. BVF). There are also of course things that deteriorate.
FIS seems to be one of those stocks at this point in time. I am much more apt to trade these higher volume names now with respect to trading options. In this case the September $28 puts are attractive from both a delta, price and liquidity perspective.
Cost basis is $1.80.
Charts:
Daily:

4hr:

Tuesday, August 17, 2010
TED "I can't believe its not butter" Spread

Interesting how the RSI indicator never confirmed a bullish trend in TED..that should have been our first indicator for the rally in July
UPDATED Trade: Long ACOM via Equity
UPDATE
13-AUG-10: I tried to exit half the position in the morning but ACOM simply ran away to the stop. So, this indeed became a break even.
Charts:
Daily:

4hr:

12-AUG-10:
OK, so again I am in a dilemma that I have been in before. ACOM is now inside the bands, and violated on a %R basis on the daily chart. The same is true for shorter term charts like the 4hr. However, the 13 day EMA is still very much intact and my stop of $19.38 is well below the 13 day EMA which currently stands at $19.91. If it get out tomorrow morning I lock in a minimal profit, but a profit none-the-less. If I wait and see what happens at the 13 EMA (and this market) then I get a chance to increase my profits.
However, if I do wait to get stopped out, then I loose no money...but have also kissed a small gain goodbye.
I think I will be HOLDING on this one. If the market does fall apart (and I am not yet convinced it is doing that)...then I will get stopped out and I learned a lesson in discipline and following my original plan. However, the 13 EMA is really becoming a big part of my decision making process...So maybe ACOM will be the thing that tells me to finally make the 13 EMA part of my trading plan moving forward.
Let's see what happens.
9-AUG-10:
The 2 for 1 rule fired my trade trigger. So half the position has been taken off and it is now a free trade. Meaning I will not loose money on it. Yeay!
This reduces the cost basis to $19.38 per share instead of the original $20.
4-AUG-10:
Picked up a bunch of shares of ACOM this morning for $20 each due to the Retest outside of the bands yesterday. For those following along I apologize for not publishing the Outside the bands post yesterday I was very busy with other endeavors.
I went with shares because of recent experiences with illiquid options...ACOM is one of those things that trade just about 250k shares per day, so their options aren't very liquid. So equity it is. Position sizer gave me all these different sizes for all the different accounts.
Stop in all accounts is $19.38...Now don't you bastards take it there just to shake me out please.
The thing I like about ACOM is that it is a highly rated IBD stock, reported a great quarter, and it posted a 52 week high yesterday (the day it reversed for the retest). So to me this is a nice retest and the reversal yesterday probably took out some guys who jumped in on the breakout...nonetheless, I have a good stop and I hope this thing takes me to good places. The traditional technicals also look good, its a nice cup (with maybe a handle being formed with this retest...anyway fingers crossed.
Charts:
Daily:

4hr:

Outside the Bands
Retests outside the bands:
Longs:
None outside.
Inside the band longs:
AGP, ECLP, GENZ, ERY, VOD, TITN, KMB
Shorts:
PVA, XLNX (not really because it never confirmed..but intraday could be a trade)
(lots of retests inside the bands today...not going to go through them)
Breakout Longs:
CHL, DCM, PAR
Breakout Shorts:
GLW
Longs:
None outside.
Inside the band longs:
AGP, ECLP, GENZ, ERY, VOD, TITN, KMB
Shorts:
PVA, XLNX (not really because it never confirmed..but intraday could be a trade)
(lots of retests inside the bands today...not going to go through them)
Breakout Longs:
CHL, DCM, PAR
Breakout Shorts:
GLW
Monday, August 16, 2010
Outside the Bands
Retests outside the bands from Friday:
Longs:
LFL
Shorts:CHT, ASR
Breakout Longs:
AEE
Breakout Shorts:
LSTR, RRGB,CACI
Longs:
LFL
Shorts:CHT, ASR
Breakout Longs:
AEE
Breakout Shorts:
LSTR, RRGB,CACI
Saturday, August 14, 2010
Outside the Bands
Retests outside the bands from Friday:
Longs...None outside.
Inside the band Longs:
NJR, LCAPA, UFS, BG, FOSL, CELG, DTV, BIIB, PFE, KMB, ABT, AMZN, HANS, CXW, CHL, AMP, AGNC, CAGC, EWH
I bolded a few that are of interest and potentially tradeable.
Shorts:
FIS, ETP (but these didn't really confirm on the daily chart...but its nice to see my positions come up on this screen)
Inside the band shorts:
HSP, WMS, XEC, VXX, CLH, TSN
Breakout Longs:
CHSI (retested a few days ago), ASCA (fresh), NFLX, AEM, IT,
Breakout Shorts:
NXY, SAP, TDC, TRN, RSG, BRCM, PLXS, NTAP, CSCO
note some of the ones listed above are not confirmed on %R, but I included them because of other endearing qualities.
On another note there are 88 stocks outside the lower bands...so...there should be lots of short opportunities in the days to come.
Thursday, August 12, 2010
Wednesday, August 11, 2010
Market musings...
Not that my opinion matters, markets got killed today and the low volume saviors didn't show up.
I will say that on the way home today I was listening to Pimm Fox and his "taking stock" show and wouldn't cha know it...Bob Prechter was on spewing his usual shit and how he just called this top last week...(hat tip pennyman for the link)
Pimm of course didn't ask him about all the million other erroneous top calls Prechter has made in the past.
Last night I attended a not so useful discussion where Sam Stovall of S&P gave a talk about whether or not diversification failed. He says no, if you had a 60/40 mix of equities and bonds...you would have only lost 13% or something at worse in the big bear of 2008.
But more of his talk was nice to hear. He mentioned statistics about the number of 2% days in market history...I forget the exact numbers but up until 1996 or so these events were rare...extremely rare.
Sam Stovall last night said that since 2000 we now have more than 2 times the number of 2% days on average per year.
Yesterday I got lucky and found an opportunity in ETP to go short something decent since I was totally exposed to the long side. This was a bit of luck, but also took guts...I can't remember the last time I put on a counter trend trade at a level close to resistance. I feel like this was one of my best trades this year...not so much because of the money involved, but because I acted on a good setup and knew to ignore new longs and put on a short.
In any case, after hearing those stats from Stovall last night, its good to remember that days like today are now becoming commonplace thanks to the computer trading and the Hal 2000s. Volatility seems like it is here to stay and this is the new normal. If anything is for certain this is it.
And for Sam Stovall to be preaching buying and holding last night...with this piece of knowledge in his head just made me less inclined to believe his philosophy.
I say this. Buying and holding is fine if you are a multimillionaire and have a small piece of your fortune in the market just to help pay for the servicing of your yacht and summer homes.
For everyone else, you best consider shortening your holding periods and using options to help cushion falls.
But today isn't that rare of an event anymore and we are now at a crucial support level, right now I am with Alphahorn...this is probably just another buy-able dip.
But tomorrow will tell us for sure.
Outside the Bands
Retests outside the bands today:
Longs:
RGS, PKI, CHSI
Shorts:
None outside the bands today.
Inside the bands:
MATK, PSQ, SKF, DUG, SQQQ, EEV, EUO, EPV, EDZ, SDS, RSW, DXD, QID, VXZ, SMN, UUP, SPXU, SH, DOG, MZZ
Breakouts:
Longs:
IT is the only fresh one...the following are still outside the bands after some time:
PTRY, CTXS, TTM, CNK, SXCI, WTW, SWSI, TIP, MGLN, WCRX, APL, FOSL, ACF, PCY, PCLN, FDO, VZ, IEF, PGF
Shorts:
NILE, JCP, MR...these are fresh
Not so fresh:
PWR, MDAS, UVV, OCR, NTRI, PBI, OSTK, BIG, ARO, BEC, ESI, VPRT, VMC, TSN, SAFM, APEI, CEG, CBOE, VLTR, HPQ, PEGA, BHI, LANC, DV, CSL, LOPE, WY, CECO, MLNX, WDC, UTI, CAG
The not so fresh include anything that has closed consecutively outside the bands in at least the last 2 days and have also had consecutive closes in overbought/oversold of %R.
These are good to watch for retests.
Longs:
RGS, PKI, CHSI
Shorts:
None outside the bands today.
Inside the bands:
MATK, PSQ, SKF, DUG, SQQQ, EEV, EUO, EPV, EDZ, SDS, RSW, DXD, QID, VXZ, SMN, UUP, SPXU, SH, DOG, MZZ
Breakouts:
Longs:
IT is the only fresh one...the following are still outside the bands after some time:
PTRY, CTXS, TTM, CNK, SXCI, WTW, SWSI, TIP, MGLN, WCRX, APL, FOSL, ACF, PCY, PCLN, FDO, VZ, IEF, PGF
Shorts:
NILE, JCP, MR...these are fresh
Not so fresh:
PWR, MDAS, UVV, OCR, NTRI, PBI, OSTK, BIG, ARO, BEC, ESI, VPRT, VMC, TSN, SAFM, APEI, CEG, CBOE, VLTR, HPQ, PEGA, BHI, LANC, DV, CSL, LOPE, WY, CECO, MLNX, WDC, UTI, CAG
The not so fresh include anything that has closed consecutively outside the bands in at least the last 2 days and have also had consecutive closes in overbought/oversold of %R.
These are good to watch for retests.
Monday, August 9, 2010
Outside the bands
Retests outside the bands today:
Longs:
TSU...incredibly juicy setup..I may have to take this.
Shorts:
None outside
The TOS hamsters are on strike and this is as far as I am going to get tonight. So sorry..no inside the band retest list tonight...I did see early in the day CBD was retesting just inside the bands...again juicy enough to trade.
China...must read
Over at TBP, in between making me green with envy about some annual fishing trip Hedge fund managers convened at in Maine this weekend...John Maudlin gives us a long piece about 2 shitstorms...one involving state pensions, and the other shitstorm brewin' in China...
All we read about is how wonderful and powerful China is...but John relays something from Simon Hunt...apparently an expert in all things China.
In short, just as we screwed shit up (ala Grande Depression) directly after our Industrial Revolution (the one in the 1920s)...China is on the verge of the same challenges, according to Hunt, they are knee deep in some of the same difficulties we had in our Industrial revolution.
Anyway...go read it, its a doozy, but not everyone talks about shit like how little water there is in China and how much of a problem that is to real growth over there.
Thursday, August 5, 2010
Outside the bands
Outside the band %R retests today: NONE
Inside the bands
Longs:
102 charts to sift through...fuck...
HCP, EQR, RSG, BEXP, EPI, CRZO, NNN, PPL, SLE, CRUS, CREE, NE, TS, TDC, DCI, ATW, TDW, TM, RYN, UIS, FNSR, CPX, INFY, ACOR, ANSS, ECLP, ACC, LOPE, LINE, ADTN, OGE, RYAAY, BUD, HSNI, SNA, BMRN, MKC, FIRE, CLP, IWO, HR, BBEP, SKM, BF/B, SWSI, NPO, TAM, ENP, HTLD, ROP, MINI, MKSI, FFBC
Shorts:
CTRN, MLM, CRK, MPWR
Breakouts:
Longs:
DBA, TSU, LEA, SNI
Shorts:
PBI, HSP
Wednesday, August 4, 2010
Fed action?
Over at briefing...a multiple-time-per-day read for me...cuz the guy who writes it is just too funny. The bond market got this:
From Wikipedia:
I don't know if this clears it up for any of you...but since they are using MBS as collateral, this is an exit strategy....I confirmed it with my buddy GX...here's his take:
I sware I can't figure some of this crazy banking juditsu out...I thought this would be welcomed with a big badonkadonk over in bond-land but I guess since it's such a small amount...nobody cares....kind of like when that test of the emergency broadcast system happens to your TV...
10:52 ET 10-Yr: -09/32..2.941%.. USD/JPY: 86.35.. EUR/USD: 1.3139I have no idea what reverse repo's do or are...I just know this seems to be written with a bit of snark and stuff...hopefully someone like Boockvar will take notice and explain it to us stock idiots.
Fed Up: The Fed purchased $0.180 bln in tri-party reverse repo as part of the operational readiness program announced on Tues in the small scale tests. They will continue to conduct "similar series of small-scale, real-value reverse repurchase transactions with primary dealers using all eligible collateral types, including, for the first time, agency mortgage-backed securities (MBS) from the SOMA portfolio"...BUT "Like the earlier operational readiness exercises, this work is a matter of prudent advance planning by the Federal Reserve. It does not represent any change in the stance of monetary policy, and no inference should be drawn about the timing of any change in the stance of monetary policy in the future." Got that?
From Wikipedia:
A Repurchase agreement (also known as a repo or Sale and Repurchase Agreement) allows a borrower to use a financial security as collateral for a cash loan at a fixed rate of interest. In a repo, the borrower agrees to sell immediately a security to a lender and also agrees to buy the same security from the lender at a fixed price at some later date. A repo is equivalent to a cash transaction combined with a forward contract. The cash transaction results in transfer of money to the borrower in exchange for legal transfer of the security to the lender, while the forward contract ensures repayment of the loan to the lender and return of the collateral of the borrower. The difference between the forward price and the spot price is the interest on the loan while the settlement date of the forward contract is the maturity date of the loan.
I don't know if this clears it up for any of you...but since they are using MBS as collateral, this is an exit strategy....I confirmed it with my buddy GX...here's his take:
"...It sounds like they are taking money out of the system by selling securities from their SOMA holdings (system open market account) with the agreement to buy them back at a predetermined date (maybe as short as overnight) at a pre-determined rate.
So, as a bank, if i want a place to park some cash i can do so by lending money to the fed in the form of a repurchase aggreement (i sell and agree to rebuy). it would be a good alternative to leaving my cash in Fed Funds, assuming that the rate is higher.
It's interesting to hear about them draining liquidity at a time when pundits want more quantitative easing....probably the reason for the long explanation, second half... "this does not change our stance on monetary policy"
makes sense (i buy it) with such a tiny amount.
I sware I can't figure some of this crazy banking juditsu out...I thought this would be welcomed with a big badonkadonk over in bond-land but I guess since it's such a small amount...nobody cares....kind of like when that test of the emergency broadcast system happens to your TV...
UPDATE Trade: ARMH long via Calls - Loser
UPDATE: 3-AUG-10 thanks to a gap down yesterday, ARMH triggered my sell order. I got lucky with an intraday rebound that hit my target exit price. I got filled at 2.70, 2.75, and 2.80 depending on the account.
Loss ranged from $177, $378, $440 depending on the account. Stops are stops. Luckily this gap got semi-filled and allowed my order to fill..otherwise the losses would have been bigger.
Nonetheless, the only warning sign this gave was a %R violation...but that violation occured outside the Accel bands, since I need 2 signals to fire, I didn't panic over that. Also yesterday's gap was based on a Market Perform initiation by William Blair. 13 day EMA was held at the end of the day.
Charts:
Daily:

4hr:

28-JUL-10: So a nice leader of the IBD 100 retested outside the bands yesterday and I decided that it was worthy going long ARMH.
Went with Oct $12.50 calls at a cost of $3.29 (yeah I somehow got filled at that price with a limit of $3.30)...all my options trades of late have been as close to 90 delta as possible so that my ATR position sizing formula works to some extent even with options...so I dont get stopped out prior to the actual stop on the stock like UL...(PS I re-entered UL in the taxable account today since it retested...the retest was inside the bands but it demonstrated support at the 13 EMA)
In any case charts follow.
Daily

4hr

Monday, August 2, 2010
Outside the bands
Retests outside the bands today...
Longs:
None outside.
Inside the band longs:
SHY, EW, AGG, ATHN, LLTC, TYD, BND, CSJ, ABV
Shorts:
CBD...HSP and ASIA come up in the scan but they haven't confirmed on %R so they aren't true retests...though they are outside the bands.
Breakout longs:
DISCK, EXPE, AVP, EMN, AEIS
Breakout shorts:
THOR, VLCM (neither have confirmed on %R)
Subscribe to:
Comments (Atom)