OK. So Bob Lang got us out of ADBE for a decent 40% win just before they released earnings and took a nose dive...Thanks Bob.
So far in the Month of September every single trade Bob Lang has posted as part of the Grand Slam service has been a winner however slight or large....He hasn't posted many new trades and currently we are holding some HAL, QLGC, and NVDA calls.
Headley's Sniper service hasn't been as lucky with a few loser like SNDK but overall these services have pumped the accounts decently.
Just 2 days ago I fired off a trade on some MCP calls based on a retest...well the retest kept going. It caused some serious pain as it broke through some major technical stops (CCI 0 test was about the only thing that held on the hourly)...on the daily thought it was a bend don't break scenario....well my money management stops had also been triggered and I was in meetings all day so I took a loss bigger than my normal loss...this was hard because that bottom level held and of course it has been rallying ever since.
So big loss was taken and there isn't much to say about it except it was a tough trade, I almost toughed it out and at the very least I didn't panic at the bottom.
I put my order in for a higher price waiting for a rebound in the selling...bought them at $5.50 sold'em for $3...this sucks...but that's the way it is. I had to exit based on my rules...
In this case I should have put some trade triggers in but that would still result in a sizable loss....anyway the accounts all suffered about 2.5% losses on this one...or grand total of $2250 loss.
Thursday, September 30, 2010
Trade: Long F...winner
30-SEP-10:
I put in a trade trigger during my time in Paris for this to get out at $1.70...this was because these were weeklies and I didn't want to be in them for a long time and the market has been choppy.
Across all the accounts this was about $1,000 winner as the trigger was fired on the 21st of September...not bad for 5 days.
Not much per account but overall it was a good trade.
Chart:
Hourly

16-SEP-10:
In my scans today I picked up a high volume rise in F...The uniqueness of this move is seen on the hourly (and even the daily) chart. The volume was big today in Ford and the bollingers on the hourly chart had gotten really tight and in sinc with the accel bands etc...so I watched the 15 minute chart after the breakout to see if I could get a retest to get in. I watched it come towards the 13 EMA and bounce and while there wasn't a true retest at that stage, I figured it was decent enough to get in at that point.
So I played the weekly options expiring next week (issued today). Picked up the Sep 24th $11 calls for $1.50 each.
Unfortunately I had a meeting and couldn't wait for a true retest...which did happen just after I left my desk...(of course) so I probably missed out on a dime here...but that's the breaks when you have a stupid day job.
A decent target for this is the 80 period daily upper bollinger band...if it is launching it could hit that by next week...that stands at 13.40...So from my purchase price it will probably net me $1 per contract...66% winner wouldn't be bad at all.
Charts:
Hourly:

15minute:

Daily:

Trades: Short EEP and PCG...both losers
30 SEP-10:
OK enough laziness..I need to update this blog not just for y'all but for myself.
I gotta say that since I turned over most of the trading to the good people at Big Trends...I have gotten lazier about this blog...
Anyway EEP was a looser. my stop was triggered on September 20th for $2.00 per contract. This was an $0.80 per contract loss. Fairly painful. But EEP kept going higher and higher...so I was right to put that trade trigger in during my travels.
Both of these had tripped technical stop points well before I got out of them. In EEP's case I got out soon after the technical stop was
PCG I just got out of today for $4.60 each. For a minor loss of 0.90 per contract (fewer contracts than EEP that's what makes it minor). Across all accounts this was a $630 loss. Easy to bear.
Now I held PCG because when it broke the technical stops on the intraday charts...it never closed the gap on the daily chart, and it never confirmed closing over the 13 day EMA...Also there was a big dividend coming so I knew that once that came through we would have a drop...so patience led me to hold on until the loss was really miniscule.
Charts:
EEP Daily

PCG Daily

14-SEP-10:
I have been trolling for shorts in case the 1130 area holds on the SPX as the top of the range (again). Also being net long is a bit nerve racking, especially as we are headed into resistance and we are a bit overbought.
Anyway EEP and PCG both fit the bill, both had heavy volume downside moves recently, and today both were retesting on %R at the hourly level.
I picked up October $55 puts in EEP for $2.80 each.
I picked up October $50 puts in PCG for $5.50 each.
Both had decent open interest and good bid/ask spreads...not super duper great...but good enough to trade for sure.
Charts:
EEP
4hr:

Hourly:

PCG
4hr:

Hourly:

Sunday, September 26, 2010
Back from Paris
Ok so Paris went well...I had one really long day of walking around and taking pictures (you can view them here). I accomplished most of the goals with the exception of Monte Martre and finishing the books. I got a little headway in Think and Get Rich...but alas, Babies, Iron Man 2, The Departed and sleeping all took precedent on the plane.
Anyway...I had a decently successful week trading...I got stopped out of EEP, but took profits on F, NOV, ADBE. Also entered some new positions that came through the pipe from Big Trends...anyway not bad and in this case being 6 hours ahead of the market was helpful since I could actually concentrate on work and still put trades in the early afternoon.
What I am saying is that it would be great to move to Europe and trade the US markets...
Anyway I will try to update some of the trades posts that I have done last week but its a busy weekend and I am also getting over a cold that I caught in Paris. C'est la vie.
Saturday, September 18, 2010
Off to Paris
So...Thanks to my real job I am going to Paris for the week...I have a lot of open positions on and I am hoping that I can manage them all from my Blackberry in Paris.
Nonetheless...I think I will be placing emergency stops and profit taking triggers to let the computers take over the trading while I am there...being 6 hours ahead of NYSE time doesn't really help if you wind up working through most of the morning's action...I experienced this once before when I went to Lisbon for work...and had open positions...I made stupid maneuvers on a RIG spread back then...
Anyway...this is my first time in Paris and I am excited about that. What I want to accomplish is fairly simple, take some great photos and see the Eifel Tower, Notre Dame, the Louvre, Montmartre, and le Quartier Latin...I also want to eat like 5 Croissant's per day and drink massive quantities of wine, not to mention eat eat eat every single meal I can until my belly explodes.
I also plan on finishing 2 books on the plane ride (unless I am tempted by the movies on board)...Think and Grow Rich by Napoleon Hill and Flow by some God awful name impossible to reproduce.
Wanted to share the following link regarding the market...I hope Moby Waller is right...but apparently there was a tremendous amount of open interest in Sep 113, 114, 115 SPY calls...he claims that all this worthless paper frees up the market to actually break through the 1130 mark...I hope he's right...but Friday was awful volume for an S&P rebalancing/Quad witching end of Quarter day....we didn't even trade 2 Bil shares...in fact...it was on track to be the worse quad witching volume day ever...
Anyway also...this has been making its way through the internets...but go read Micheal Lewis' Greek thing in Vanity Fair...its a gem and it will unfortunately enlighten you that Greece will end in tragedy..
Wednesday, September 15, 2010
Trade: Long OPEN...winner
15-SEP-10:
Update...in true trader mentality I decided it was time to get rid of OPEN and take my profits...Sold the contracts today for $9.00 a piece...a profit of $250 per contract....accross all the accounts (9 contracts) that's a profit of $2250..that's more than my wife makes in a month so I am happy with that...I think that's probably a new goal of mine...to make enough on one trade to cover my wife's salary.
This wasn't a homerun but it was a good double... but I have very little faith in this rally at this stage and traders take their profits when they can...OPEN may very well keep running but I am at peace with that. I am trying to think more like a trader and less like an investor...there are multiple opportunities just like OPEN that happen everyday...So I will get on board those and get off board just as quickly.
13-SEP-10:
Decided to enter into a long today despite the market being near the top of its recent range. Some stocks are simply not giving up the goose or (as in OPEN's case) looking like giving up the goose then finding support at key levels and demonstrating retests.
OPEN has been on my side radar for a while because it consistently appears on IBD's Stocks on the Move. While I have missed the ride until this point, today's gap and subsequent sell-off offered a nice opportunity for entry on a very short term basis today.
Today OPEN popped out of the bollinger bands and followed through by confirming in the 2nd hour of trading. Then the fade began and that took us until about 2PM. The hourly chart was showing a %R retest and the 15 minute chart was showing a DMI kiss in the making along with a CCI retest.
I checked this out with more scrutiny because I noticed that the options in the 50-60 strike range had high open interest and the bid/asks were decently tight...also the chart of the option itself was showing a retest on %R as well...
I then watched the action in the underlying itself as it neared the bottom of the day's action...the bid/ask spread was very wide and no business was transacting...within a few minutes they came together and the stock put in a fat green bar on the 15 minute chart.
I pulled the trigger at that point on the October $55 calls for $6.50 each...
A decent target is around $8.80 which is where these options traded earlier today prior to pulling back.
Charts:
1hr:

15 minute:

4hr:

October $55 Call 1hr chart:

Thursday, September 9, 2010
General update
So I signed up for some Big Trends services including the Grand Slam Options and the Options Sniper. GS is handled by Bob Lang, and OS is handled by Price Headley. They take different approaches. I am still figuring out Bob Lang's approach but he is incredibly basic in his approach. He uses RSI, MACD, Volume, %R, Bollinger Bands and MAs...Most on standard settings...but he does fire a lot of trades off...so much so that I can't keep up with it all on the blog if I am to trade all these things.
The Sniper service takes an approach based on multiple time frames but mainly the hourly chart to come up with signals etc. However, I have noticed that he deviates from his own "plan" relatively often. I see many stops that simply get ignored, or I see stops not get violated and then him putting out exit orders anyway.
I guess I should blog on these trades if I can because in the end I have a subscription to these services for 3 months. If I decide to go for the whole year they will have to pay for it with trades. So far Bob is doing a better job in this rally than Price...but it's just a matter of luck, they can't both be trading the same stuff and some trades are going to work out some are not...Price has just been on the not working out side. C'est la vie.
Nonetheless I wanted to explain the lack of blog entries lately, I have been trading a lot with these guys just not documenting the trades all on the blog.
I am going to try to get better at that, but because these guys provide nightly emails with the summary of their thinking and include charts most of the time...its a bit superfluous to blog about it.
This is my journal to document trades first and foremost, so if that is done in emails from Bob and Price then I don't need to do it here.
Perhaps the approach I will take is to post when I think they have deviated from the plan. This is easier to do with Price than with Bob because Price is straight forward about what his plan is based on, but I will get to the bottom of Bob's brain as well.
Anyway that's it. I also decided that I am reading a lot of shitty economics lately so get ready for some economic jibberish from me in between all this trading.
Mahalo
UPDATE Trade: Short CVD Equity...winner
UPDATE 9-SEP-10:
Exited this position fully today just based on time in trade, and the need to free up capital for other opportunities, this thing hasn't moved much up or down but the 4hr has started to perk up on the 13 EMA...so that's good enough for me. Covered the 100 shares I had left for $39.
So let's see that's a total profit of $450...not a bad trade for a 1 month holding...still too long for such a "small" profit.
4hr chart:

UPDATE 12-AUG-10:
Trade trigger fired this morning with the rapid drop in CVD. This is now a free trade! Covered 100 shares for $39.68 this morning. Current Cost Basis is now $40.63. It is nice to not worry about loosing money anymore and to also have more buying power free.
6-AUG-10:
Went short 200 shares of CVD in the taxable account. Got filled at $41.59 per share. Stop is $43.41.
This has a massive move down already but it is officially an outside the band retest as of today.
I needed some short exposure and there isn't very much these days that isn't beat up to a pulp. CVD has terrible ratings and is in a terrible group. So I figure despite the move down, there may be further to fall for this puppy.
As always, I hope I am right. But I expect to be wrong.
Charts:
Daily:

4hr:

Tuesday, September 7, 2010
Trade: Long ARST...loser
7-SEP-10:
I actually exited this position on Friday. After beating earnings ARST didn't go anywhere and got taken down a bit. In any case, my stop was taken out right at the beginning of the day and I had to leave the position. $200 loss.
1hr chart:

2-SEP-10:
I put on a really small position (1 contract Sep $32.5 call for $6.10) in ARST yesterday afternoon...This was based on the recent spike in ARST which came on massive volume. Also all hourly signals fired that fabled day.
ARST reports today after the close which they will divulge details of them putting themselves on the auction block. I am not happy with the open interest in the options at this strike but the delta etc lead me to choose this one.
Anyway it was near the CCI retest low when I picked it up and it is holding that low...
Let's see what happens:
Daily:
1hr:

I actually exited this position on Friday. After beating earnings ARST didn't go anywhere and got taken down a bit. In any case, my stop was taken out right at the beginning of the day and I had to leave the position. $200 loss.
1hr chart:

2-SEP-10:
I put on a really small position (1 contract Sep $32.5 call for $6.10) in ARST yesterday afternoon...This was based on the recent spike in ARST which came on massive volume. Also all hourly signals fired that fabled day.
ARST reports today after the close which they will divulge details of them putting themselves on the auction block. I am not happy with the open interest in the options at this strike but the delta etc lead me to choose this one.
Anyway it was near the CCI retest low when I picked it up and it is holding that low...
Let's see what happens:
Daily:

1hr:

Friday, September 3, 2010
Update Trade: BKC Long Calls...loser
3-SEP-10:
I wanted to put down my thoughts on this one more time. You may or may not have looked at this chart since I left this trade (but I will post it after this update anyway).
Remember, I entered this trade for various reasons, but the primary reason was that there had been a massive spike in options volume in the October $20 strike that continued over a few days as the underlying got faded. It had matched technical indicators on the hourly chart.
My main mistake on this was probably my choice of trade. The technicals deteriorated rather quickly and i followed my discipline and exited for a small loss. This was prudent for the next few days...and discipline is discipline.
However, what I should have done is go right along with the whale that was picking up these options in the first place. I shoudl have simply defined my risk differently. Instead of getting a higher delta position and stopping myself out if it reached my risk comfort level. I should have simply picked up the out of the money strike calls and put up money I was willing to loose and then just forget about it.
So instead of buying 10 contracts in the 90 delta strike for $1.15...I could have 1. waited for CCI retest, 2. gone with the October $20 strikes paid about 0.60 each contract and bought only 3 or 4 contracts as a "lottery ticket." Simply said..if this whale is right...then I get to ride with him. If he is wrong...then I loose what I would have lost anyway...
I for one will start looking for these types of scenarios a little more closely...the setup here was fairly clear...very high volume in the underlying accompanied by very high volume in the out of the money options.
Anyway here is a chart to enable me to make a shitload of money the next time I see a similar situation...or at the very least...loose the same amount of money.
There are few things more painful than watching a great call fullfill its prophecy WITHOUT being on board and imagining the money you would have made if you were...this is an incredible lesson in matching strategy to the situation and matching risk to reward...but just matching the risk is important enough..
Every trade should begin with the same statement "I am willing to loose X on this trade" I have various ways of making this loss occur and you should always find the way that matches the risk and maximizes the reward at the same time as leaving you in the trade....stay with the trade in this case was more important than the technical breakdown in the stock....because the whales were telegraphing the potential of a takeover...and they were giving you the basic price...If the whale was willing to spend a shitload of money on a strike that was way out of the money...even if it came close to $20 he would profit handsomely.
Anyway its a wonder that the SEC doesn't investigate these types of shenanigans...this was blatantly obvious that someone knew something about this LBO.
Painful Chart:

27-AUG-10:
This morning BKC violated a retest on CCI. I exited for 0.95 per contract or a loss of 20 cents...$200...I am being very aggressive on defense here on a long that will probably work out...but the market is not really happy looking right now and longs are really hard to justify being in. BKC has a long term down trend in place and fighting that is tough to do.
Anyway I should have waited a little longer to get into this in the first place. Instead of %R retest...I should have waited for a CCI retest. One flaw on this was that DMI difference never went above 30 so that move on Tuesday wasn't confirmed on DMI Diff...so that may have been the thing that should have kept me away. I let the news about the high options volume cloud my judgment on this one...that whale buying calls in October has a longer term time horizon and a lot more money than me...so he wins...
17.25 was support now it is resistance so that's that...had i waited until this morning to enter I would probably still be in this trade and that is a lesson I will probably end up learning with this one...patience and waiting for that CCI retest is the lesson here...when trading the hourly that's what I needed to do.
Chart:

26-AUG-10:
As per last night's post, I noticed that BKC had triggered a buy signal on the hourly...I didn't really look at the news until this morning...from flyonthewall:
Indeed, and the action continues this morning...this time in the September $20 strikes.
Anyway...I waited for a %R retest and got in to the October $17.5 for $1.15 each 10 contracts...Let's see what this whale wants to do with this company.
I am busy with work...post charts later.
I wanted to put down my thoughts on this one more time. You may or may not have looked at this chart since I left this trade (but I will post it after this update anyway).
Remember, I entered this trade for various reasons, but the primary reason was that there had been a massive spike in options volume in the October $20 strike that continued over a few days as the underlying got faded. It had matched technical indicators on the hourly chart.
My main mistake on this was probably my choice of trade. The technicals deteriorated rather quickly and i followed my discipline and exited for a small loss. This was prudent for the next few days...and discipline is discipline.
However, what I should have done is go right along with the whale that was picking up these options in the first place. I shoudl have simply defined my risk differently. Instead of getting a higher delta position and stopping myself out if it reached my risk comfort level. I should have simply picked up the out of the money strike calls and put up money I was willing to loose and then just forget about it.
So instead of buying 10 contracts in the 90 delta strike for $1.15...I could have 1. waited for CCI retest, 2. gone with the October $20 strikes paid about 0.60 each contract and bought only 3 or 4 contracts as a "lottery ticket." Simply said..if this whale is right...then I get to ride with him. If he is wrong...then I loose what I would have lost anyway...
I for one will start looking for these types of scenarios a little more closely...the setup here was fairly clear...very high volume in the underlying accompanied by very high volume in the out of the money options.
Anyway here is a chart to enable me to make a shitload of money the next time I see a similar situation...or at the very least...loose the same amount of money.
There are few things more painful than watching a great call fullfill its prophecy WITHOUT being on board and imagining the money you would have made if you were...this is an incredible lesson in matching strategy to the situation and matching risk to reward...but just matching the risk is important enough..
Every trade should begin with the same statement "I am willing to loose X on this trade" I have various ways of making this loss occur and you should always find the way that matches the risk and maximizes the reward at the same time as leaving you in the trade....stay with the trade in this case was more important than the technical breakdown in the stock....because the whales were telegraphing the potential of a takeover...and they were giving you the basic price...If the whale was willing to spend a shitload of money on a strike that was way out of the money...even if it came close to $20 he would profit handsomely.
Anyway its a wonder that the SEC doesn't investigate these types of shenanigans...this was blatantly obvious that someone knew something about this LBO.
Painful Chart:

27-AUG-10:
This morning BKC violated a retest on CCI. I exited for 0.95 per contract or a loss of 20 cents...$200...I am being very aggressive on defense here on a long that will probably work out...but the market is not really happy looking right now and longs are really hard to justify being in. BKC has a long term down trend in place and fighting that is tough to do.
Anyway I should have waited a little longer to get into this in the first place. Instead of %R retest...I should have waited for a CCI retest. One flaw on this was that DMI difference never went above 30 so that move on Tuesday wasn't confirmed on DMI Diff...so that may have been the thing that should have kept me away. I let the news about the high options volume cloud my judgment on this one...that whale buying calls in October has a longer term time horizon and a lot more money than me...so he wins...
17.25 was support now it is resistance so that's that...had i waited until this morning to enter I would probably still be in this trade and that is a lesson I will probably end up learning with this one...patience and waiting for that CCI retest is the lesson here...when trading the hourly that's what I needed to do.
Chart:

26-AUG-10:
As per last night's post, I noticed that BKC had triggered a buy signal on the hourly...I didn't really look at the news until this morning...from flyonthewall:
Burger King is recently up 44c to $17.33 . BKC October 20 calls have traded 234 times on contract volume of 20,620 contracts, above its open interest of 15,300 contracts. October calls are trading at 50c above its theoretical value of 18c according to Track Data , suggesting traders paying expensive prices on the expectations of an upside move.
Indeed, and the action continues this morning...this time in the September $20 strikes.
Anyway...I waited for a %R retest and got in to the October $17.5 for $1.15 each 10 contracts...Let's see what this whale wants to do with this company.
I am busy with work...post charts later.
Wednesday, September 1, 2010
Trade: Long XOM...winner
1-SEP-10:
Got the order to get rid of XOM this morning prior to the open and set an order for selling at $2.75...that turned out to be premature as it traded much higher...the order to sell from Extreme was based on yesterdays crappy action in the 15 minute chart...but in hindsight...not sure i want to be placing orders like this right at the open...silly....anyway nothing to write home about 15 cents per contract total $75 profit...
30-AUG-10:
In Extreme today got the signal to open a long position in XOM with the September $27.50 calls. Got in at a cost basis of $2.60 each. For the most part I have 5 contracts...However, I messed up the IRA amount and I wound up with 15 contracts...I may have to cut out on this one before receiving the exit instructions as it is too much of a position to have on...and even the boys at Big Trends are wrong on a few trades.
This is a weak trade already XOM sold off the rest of the day. The only bright spot is that it is barely holding 50 on the hourly %R, and volume was weak today.
Charts:
Daily:

1Hr:

Monday, August 30, 2010
Briefing reads
So two things worth reading for not obvious reasons.
First go read Robert Green's take on the impact of Financial Reform (HA!) on hedge funds.
Bottom line, could mean less volume moving forward as Hedgies now have to report shorts...
Also, yield chasing has to start soon sez Patrick O'Hare.
First go read Robert Green's take on the impact of Financial Reform (HA!) on hedge funds.
Bottom line, could mean less volume moving forward as Hedgies now have to report shorts...
Also, yield chasing has to start soon sez Patrick O'Hare.
Friday, August 27, 2010
Are we Turning Japanese?
So I had a thought yesterday about yields on the 10 year dipping to under 2.5% and all this talk about Japan. So I thought...why not try to figure out if bonds are really in a bubble or if we are turning Japanese...
My buddy GX has access to a bloomberg so I asked him to send me a chart of Japanese 10 year yield during the lost decade and I asked him to overlay Japan's GDP:
 Yields are in Orange, GDP in White...the little spikes at the top of the GDP curve are at around the 2.5% area.
So then I was like...well where the hell are we on this chart? If we are turning Japanese we need to figure out where we are on this chart to really decide if Bonds are in a bubble of if we will go below 2% and reside there for a decade or so...
The instructive part of this exercise is to look at the ranges..Japan's deflationary spiral started in the early 90's then really took flight after a little double dip followed by a bigger double dip...but they never got over 3%ish on GDP growth during much of the 90's....that's when yields really took off to the downside and stayed well below 2% for the decade to come.
As the old addage goes..."OK the world is going to end...so what's the trade"...well that's of course why I go forth on these stupid academic exercises...and bug my friend's with bloombergs to make stupid charts for me...
GX...overlay the Nikkei:
 Green is the Nikkei.
Given our GDP growth rate (sub 2%) and the current yield on our 10 year Treasuries (2.5%) I would say we are either in 1994 or 1997 in Japanese years. Which definitely means we are looking at a deflationary spiral and our rates are going lower and they probably will stay there for a long long time.
All of this being said...Bonds have more room to run if we are indeed turning Japanese, also, Stocks will be fairly choppy for the next few years trading in a range that continues to decline overall...however at the bottoms and tops of these ranges vast quantities of money can be made...you just gotta go long and short.
For now...I guess you can still chase treasuries...
My buddy GX has access to a bloomberg so I asked him to send me a chart of Japanese 10 year yield during the lost decade and I asked him to overlay Japan's GDP:

So then I was like...well where the hell are we on this chart? If we are turning Japanese we need to figure out where we are on this chart to really decide if Bonds are in a bubble of if we will go below 2% and reside there for a decade or so...
The instructive part of this exercise is to look at the ranges..Japan's deflationary spiral started in the early 90's then really took flight after a little double dip followed by a bigger double dip...but they never got over 3%ish on GDP growth during much of the 90's....that's when yields really took off to the downside and stayed well below 2% for the decade to come.
As the old addage goes..."OK the world is going to end...so what's the trade"...well that's of course why I go forth on these stupid academic exercises...and bug my friend's with bloombergs to make stupid charts for me...
GX...overlay the Nikkei:

Given our GDP growth rate (sub 2%) and the current yield on our 10 year Treasuries (2.5%) I would say we are either in 1994 or 1997 in Japanese years. Which definitely means we are looking at a deflationary spiral and our rates are going lower and they probably will stay there for a long long time.
All of this being said...Bonds have more room to run if we are indeed turning Japanese, also, Stocks will be fairly choppy for the next few years trading in a range that continues to decline overall...however at the bottoms and tops of these ranges vast quantities of money can be made...you just gotta go long and short.
For now...I guess you can still chase treasuries...
Thursday, August 26, 2010
UPDATE Trade: BAC short...Winner
26-AUG-10: Exited the rest of the position at $1.43...total profit on 10 contracts $435...not too shabby.
25-AUG-10:
They said to take half off at $1.50...Order triggered. So new Cost Basis is 0.56 on the remaining position.
23-AUG-10:
Got another alert today from Extreme regarding BAC.
So I am short BAC via the Aug (weeklys) $14 puts.
Entered 10 Contracts for $1.03 each.
This was entered based on the hourly chart showing a retest.
Chart:

Wednesday, August 25, 2010
Sniper trades
Potential longs using the skills acquired from Options Sniper:
PAY, COST, BKC, PCG, SLV, LO...and a few others
Potential shorts:
STI, ACI, DVN, MEE
there are others but the market is at major support and the bottom of the range...so I dont really like shorts here.
PAY, COST, BKC, PCG, SLV, LO...and a few others
Potential shorts:
STI, ACI, DVN, MEE
there are others but the market is at major support and the bottom of the range...so I dont really like shorts here.
Tuesday, August 24, 2010
Trade: NFLX Long Calls...Loser
24-AUG-10:
Update Looser trade and it was a big one sold for $8 for a loss of $1040. I didn't follow the signal that was saying to exit yesterday and this cost me about $600.
Stupid stupid. Bad Bad. In any case, while I almost made up for it with GOOG, this is unacceptable and I simply should not have traded this given the system was giving only daily signal and the hourly was very range bound.
Lesson learned and this is the first time in a long time that I didn't have the discipline to cut a loss properly.
21-AUG-10:
I was looking at NFLX on Thursday as it had retested on Wednesday and rebounded nicely on Thursday.
Then Friday Headley came across with an alert not to trade but some picks for the coming week (they included long BIDU and Short RIMM). Anyway that gave me the confidence to pull the trigger (silly as that sounds).
Picked up a couple of Sep $120 Calls for $13.20 each (2 contracts). Only in the taxable account. I had chased this a little bit but that's OK. Price's target is $140 on NFLX.
I am thinking that I should have picked these up across all the accounts but I didn't...oh well.
Anyway let's hope for the best here.
Charts:
Daily:

4hr:

Trade: Short GOOG...Winner!
24-AUG-10:
Update...Sold for a cool $1,000 at $24.50...my target for this option was the lower bollinger on the daily chart (I figure this was a decent level of resistance). This level resided at around $255 level in GOOG.
The hourly chart however, says to hold on...but I hit my target and am happy with the results.
23-AUG-10:
I noticed that one thing that Headley and company focus on is liquid stocks with liquid options. They are now moving on the weekly options. This drastically reduces their universe of stocks and, I think it also increases their odds of success with every trade. Its easier to get out at the price you want if price discovery isn't a problem for the instrument...this has been a problem for me...but looking at shorter time frames you get many more opportunities....so its OK to have a limited universe because there are more bars showing opportunities.
Over the weekend, I viewed two videos that came with my options sniper subscription, which are basically coaching videos (without the sales pitch). In the videos Headley discusses the use of CCI as a primary indicator in these volatile markets, particularly its use when it comes to the hourly chart aggregation period.
Anyway the process is the same as with %R, you get a retest and that bar's high is a stop...etc you know the drill.
Looking through the small universe of stocks that have weekly options, I noticed GOOG had set up nicely last week for a fast move down, and today (right now at the 2PM hour)...we have a retest forming on CCI (and a few other indicators) ADX is still green and strong and %R is also retesting.
Anyway its a pretty good actionable trade if you ask me. Now Headley doesn't like these higher priced stocks because it reduces the # of options you have and also the bid/ask spreads are wider...so he probably wont send an alert about this one...but I am putting what I have learned to practice here.
I pulled the trigger on one GOOG Aug 27 $480 put for $14.50 taxable account only.
Chart:

Monday, August 23, 2010
Duh...
So TOS only allows scans based on End of Day data or current day's data.
So I think one way to circumvent this if you need to follow hourly signals is to break things down by how many days your signal is.
For example, a 30 bar %R period on an hourly chart is basically 30/7(bars per day)...or 4 days...
For CCI...60 bar setting...8 days
80 bar setting (bollingers)..11 days...this is rounded down (to compensate)
This could be a crude way of dealing with TOS's shortcomings with respect to scanning for hourly signals.
UPDATE Trade: BVF long calls... Winner!
23-AUG-10:
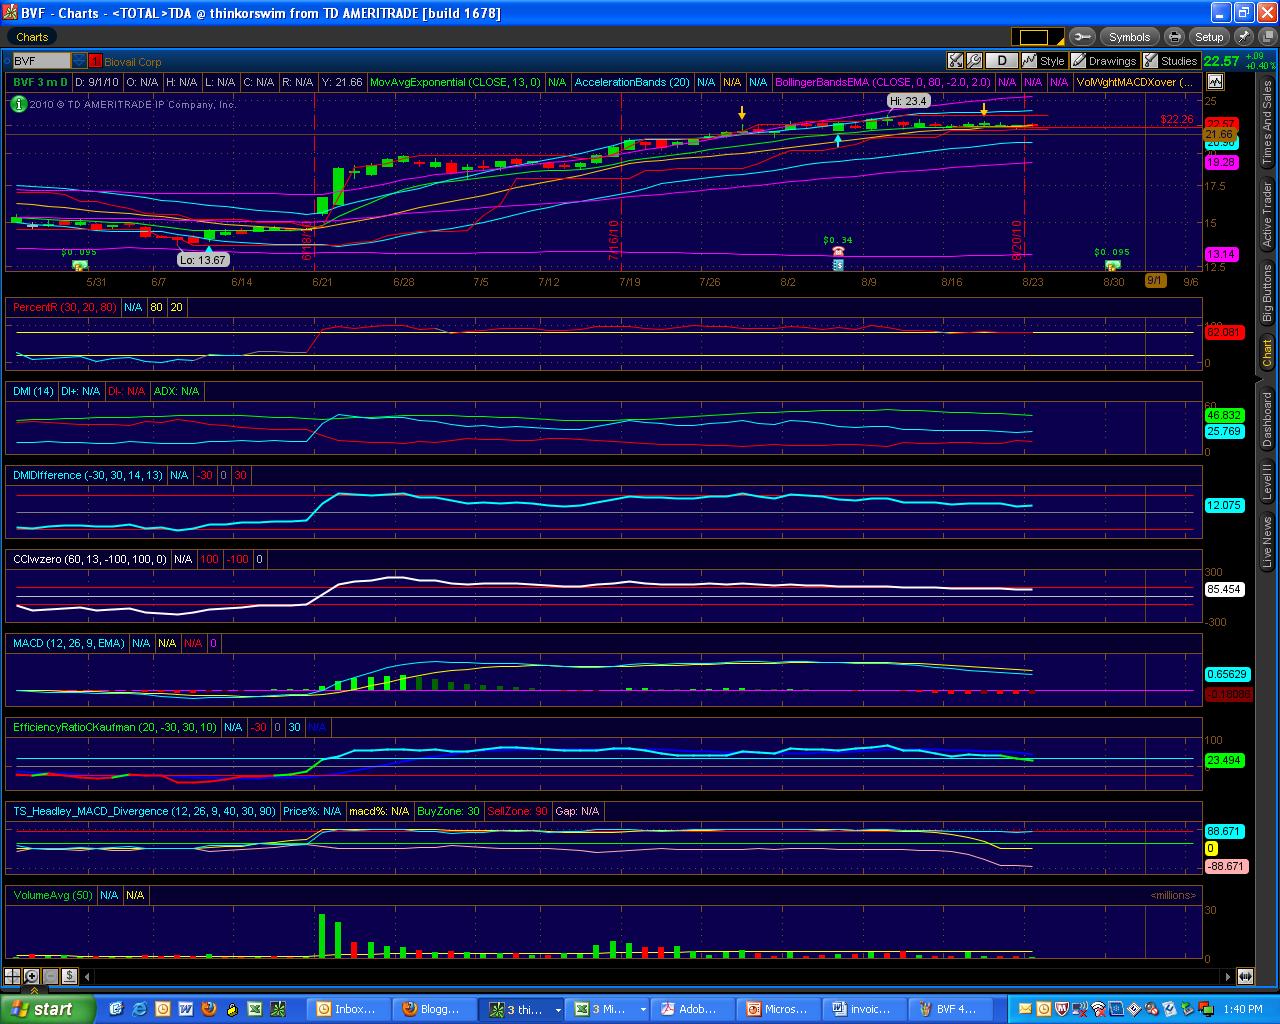
BVF has been good to me, but the profit/loss on this thing hasn't done anything since earnings...the stock has flat lined, and I have held this puppy for over 1 month and a half. I realize that this will move on the imminent FDA approval of VRX, however, I want to free up capital for the rapid moves in the Headley Sniper and Grand Slam services that I have signed up for for the next few months.
BVF has not flashed a true sell on the Daily chart, though it has done so arguably on the 4hr chart. Regardless, I want to take profits on this properly and move on...it has stalled up here and it is at dangerous heights, volume has dried up at these levels...so it can go crashing down just as well...
Cost basis was now $5.95 per contract (thanks to some profit taking previously)...I sold for $10... anyway total profit was in the neighborhood of $1,200...this was a really great trade...and all the option-able accounts benefited.
Charts:
Daily:
4HR:

6-JUL-10:
Short:
Bought 3 CRI Aug 21 2010 35.0 Put @ 8.4
This is one that popped on the scan a few days ago and due to the 4hr chart I thought I was getting in at a good price. Then I checked the market for these puts and there was no open interest. This scared me and I proceeded to try and cancel the orders I had put in...Lucky for me TOS was in a special mood today and it wasn't taking cancellation orders (this type of shenanigans also were present during the May 6th crash by the way)...SO...the orders stayed on and got filled in all but my taxable account...GOOD THING TOO...This is one of those trades where it was almost instantly profitable. The 4 hr chart doesn't really do it justice, but in the beginning of the day this was above my 13 period EMA...this was also scaring me...the volume was light though so I though it was a good short....the liquidity is a concern, but I still think I can turn a profit on these.
Nonetheless. The psychological factor here really upsets me because my taxable account isn't having any fun with this trade. I should not chicken out of trades like this anymore. When I decide to take action I should be satisfied. If anything I should have checked the liquidity previous to entering the orders, but still I would have missed this trade based on that.
One factor is that I had read 2 market forecasts (Big Trends and Noshee?) saying that the bottom may have been put in last week. This skewed my thinking for sure.
Stop is 27.17.


Short:
Bought 5 HS Aug 21 2010 20.0 Put @ 4.7
I picked this up in my taxable account today. This was something that popped on my scan on Friday. A short retest outside the bands. This is my favorite setup. I did this only in the taxable account because in this account I had missed the CRI trade in this account due to my phsycological crapping out...so I went for the next best thing which is shorting HS. I noticed Friday that this was not the only health care insurer that had this retest phenomenon, AET, UNH, also exhibited this behavior. So the sector is in trouble. However, my psychological issues right now are that we are long in the tooth with the downtrend and I fear these moves are nearer to their end than to the beginning. No matter, I am trading based on the setups.
Stop is 15.55.


Long:
Bought 4 BVF Oct 16 2010 12.5 Call @ 6.8
This was done accross accounts as a hedge against the net Shorts I am in now (besides the above I am short DCTH and CSTR (taxable account only) I have taken big profits on both positions already...so I am holding those for a while longer).
Back to the BVF trade. This thing popped big time and again showed up as a retest outside the bands on the daily chart. The 4hr chart is a bit weaker, however, still strong. If the market has found a bottom, then this is a decent hedge it is a strong stock in a weak market bucking the trend and has successfully retested and is outside the bands...The 4hr has broken the 13 EMA but regained it. This was a tough trade today and I took it because it was near enough to the retest low in price. I didn't get the best price but not too shabby either.
Stop is 18.47


UPDATE Trade: ETP Short via Puts...Winner!
23-AUG-10:
I decided to take my ETP short position off today based on the fact that after 2 days of trading since the gap down...no follow through had occurred (of course as soon as I was out of my position...down it went). On the gap down the other day it also failed to make a new low...which doesn't inspire confidence. I have also seen lots of gap downs based on new offerings turn rapidly higher.
Also, I had seen good profits go bad twice with this position...Besides that I was looking at the hourly chart and it had violated on CCI (this is a new indicator I am looking at based on Headley's Options Sniper program).
In any case, ETP has been good to me and I exited at $3.10 per contract..60 cents...and I generally had 6 contracts accross the accounts...$360 profit...not earth shattering...but good none the less.
Headley also presses the idea of time based stops...so that you can rotate your capital to the next trade that is in the early stages of rallying. So I am starting to exercise this a little more with things that are getting stale. Also left BVF today because of that.
I will say one thing. ETP has NOT flashed an exit based on the 4hr or Daily chart...so arguably this is a premature exit.
Charts:
Daily:

4HR:

10-AUG-10:
I desperately needed short exposure because I was net long and all the retirement accounts can't actually short stocks...problem is, because of liquidity, there are few options out there to suit the needs of these accounts.
Yesterday I was running my scans to see what had retested the day before or what was breaking out. In this case ETP was breaking out but not quite on the daily chart...so I checked the 4 hr chart...breakout had been confirmed...and towards the end of the day it looked like it was retesting...It reached like 19 and change on %R...I figured this was good enough for me as these options are very liquid and had decent bid-ask spreads.
Picked up the September $50 Puts for $2.50 per contract...stop is $2.00. The ask was $2.85 when my order got filled, so I figure to set the trigger at a bid of $1.80...I should get filled at $2.00
Charts:
Daily:

4hr:

Subscribe to:
Posts (Atom)